

MAKING SPACE SUSTAINABLE
OXFORD'S CLIMATE RECORD

Credit: Stephen Burt
Oxford Weather and Climate Since 1767 is an absolute gem of a book, full of weather (and who doesn’t like a bit of weather?) but also warm humanity and institutional insights, such as the fact that we owe the unbroken two-hundred-year Oxford weather record to a University decree.

Credit: Ian Curtis
Just published by OUP, this 500-page volume is crammed with immeasurably valuable meteorological data, as you might expect, but it’s presented so imaginatively that you’re left in a reverie of memory, whether for the day you rode a bike through a Port Meadow flood or the day you chilled half to death in the Bodleian.
If your time at Oxford involves any memory of a hot day on the river or a flooded Christ Church meadow, or an unusually grey, cold run when the food and hot lights of the buttery became a beacon of hope – well there’s a high chance that you can find a context for it here, connecting fragments of memory to the backbone of the longest meteorological record in Britain and perhaps the world.
No prizes for guessing why ‘climate’ has been added to the title either. An unbroken long sweep of weather records like this rather emphasises how warm it’s all become in the past twenty-five years, as shown in Ed Hawkins’ ‘climate stripe,’ shown above.
Equally, however, not all the meteorological records are from recent living memory, so that an unbroken long sweep of weather records like this also serves to guard against myopia.

Oxford's 'climate stripe', compiled by Professor Ed Hawkins, University of Reading, shows the progression of annual mean temperatures from 1815 to 2018 and the remarkable warming of recent years.
Credit: Ed Hawkins
Co-author Tim Burt, formerly Keble fellow and Director of the Meteorological Station (1986-96), currently Emeritus Professor at Durham University, asks me, ‘Last Saturday (June 29, 2019) in Oxford, – the ‘heatwave blip’ we had – how hot was it in Oxford?’ ‘Thirty-something I guess!’ ’33 degrees centigrade,’ he replies, ‘…the 4th warmest June day on record, the other three were all in 1976!’
As if bang on cue, just days after we published this feature in its first form, the all-time heat record for Oxford was smashed to pieces on Thursday July 25th, when the mercury hit 36.5 °C . Recorded by DPhil student Thomas Caton Harrison (pictured, below), this reading broke the previous max of 35.1 °C (19 August 1932, equalled on 10 August 2003). The previous July record was 34.8 °C on 19 July 2006.

DPhil student Thomas Caton Harrison recording the temperature in Oxford on July 25th, 2019. The 36.5degrees centigrade is a new record for the whole two hundred years that Oxford has data.
Credit: Ian Curtis
Records were set and remain unbroken in plenty of other years; the dismal, volcano-ash-tempered spring and summer of 1816, for example; or the blazing summer of exactly a decade later. Nature has always surprised and it’s all here in the book, with Part 6 devoted to ‘averages and extremes’ including ‘top ten extremes’ and, to give a flavour, ‘Notable heatwaves and cold spells, sunny and dull periods, in Oxford since 1815.’
There are then some ravishing Appendices if you like a bit of weather, not the least bit dull.
If you thought the sixties were cold you can check it out here. Yes, January 1963 remains the coldest of any month yet recorded; yes also, the Thames was largely frozen in January 1940, just months before the Battle of Britain. January 1776 was intensely cold but the memory would have been squandered had it not been written down.
If your memory of the 90s and noughties included regular flooding of the Cherwell you remember correctly – there is even a photo of one of the authors whizzing through a flood in his car near Wytham.
And what about last summer? It seemed hot but was it really hot against the long run? The hottest Oxford day on record remains August 19th, 1932, when the mercury hit 35.1 deg. C.
But the summer of 2018 was the hottest summer ever recorded – and the driest, with a seven-week long drought of unprecedented severity. Last summer was a meteorological phenomenon and you didn’t have to be a college gardener to know it.
The mildest-ever December was in 2015; the wettest winter-ever was 2013-14.
‘Oxford has a very clear record of global warming and I am in no doubt about the truth of this,’ says Tim.
Equally, he says that the urban setting of the Radcliffe Observatory, where the measurements have been methodically made by real humans instead of automatic recorders, may have added 0.4 degC average temperature, not a constant because of the way Oxford has developed around the site since the eighteenth century. ‘It’s the small impact of an urban heat island – although this can also be perceived as a benefit because urban heat islands are increasingly where people are living.’
Tim also confirms that Oxford has historically been a frost hollow with cold air sinking to the city, geographically something of a bowl; with greater fog as a result - cue misty dreaming spires – and the proximity of the River Thames has added to the humidity, apparently.
So where did it all begin and how did the record of weather measuring become so constant?
This is where the human narratives pile up marvellously. Thomas Hornsby, an energetic fellow of Corpus, persuaded the Radcliffe Trustees to fund the building of the Radcliffe Observatory in 1768. The primary purpose was astronomical, but it led also to weather readings on a daily basis.
This meteorological devotion was imperilled in 1935, when the astronomy function was moved to South Africa for a brighter, less smoky sky, but saved by a University decree.
Even in the 1960s there were ‘progressive’ voices that threatened the weather readings, based on the prevailing view that climate was static and therefore a thirty-year rolling average would suffice – a classic instance of the need to take a very wise if apparently ‘wasteful’ view about the value of primary scientific research faced with unknowns.
As the current Chairman of the Radcliffe Trust notes in a foreword, ‘neither Hornsby nor the Radcliffe Trustees could have realised how valuable these records would become as anthropogenic climate change becomes a major challenge to twenty-first-century society.’
At the other end of the book the authors have compiled anecdotes from a small army of Radcliffe Observers, the dedicated individuals charged with recording a battery of data each and every day, and not relying on automation.
Helen Bray (2000-2003) notes how on her first day she bent over to read the soil thermometers only to split her trousers, and in front of the School of Geography porter who was showing her the ropes. ‘Steve affected not to have noticed but when I returned to the SoG later on, he just said, ‘Changed your trousers, then?!’
Rosemary Munro (1989-91), a DPhil student and now Atmospheric Composition Manager for EUMETSAT in Germany, remembers the immaculate wisteria in Green College and also running up eight floors of stairs to the top of the Engineering Building, where the Campbell Stokes sunshine recorder (this is the terrific photo on the dustjacket of the book by Ian Curtis) burnt holes methodically in a cardboard strip.
In such instances of recollection and so many other ways the book is a loving record of Oxford without consciously setting out to be, while also being a landmark publication in its field. Only now, in the face of a climate catastrophe, are the records being correctly valued.
One broad point worth musing on is the artifice of global goals around limiting warming to 1.5 degrees, or 2 degrees, or some other ‘mean’ figure. In Oxford, the mean maximum daily temperature between June 2-26 July 2018 was 25.3 degC. This represented an anomaly to the historical mean +3.9 degC. As such climate change is being experienced in practice as extremes, not as a gentle advance.
move to carousel movement controls
 Pause slideshow
move to carousel content
Pause slideshow
move to carousel content

ASHMOLEAN BLOOMS FOR SPRING
ASHMOLEAN BLOOMS FOR SPRING
CHRIS MITCHELL
CHRIS MITCHELL
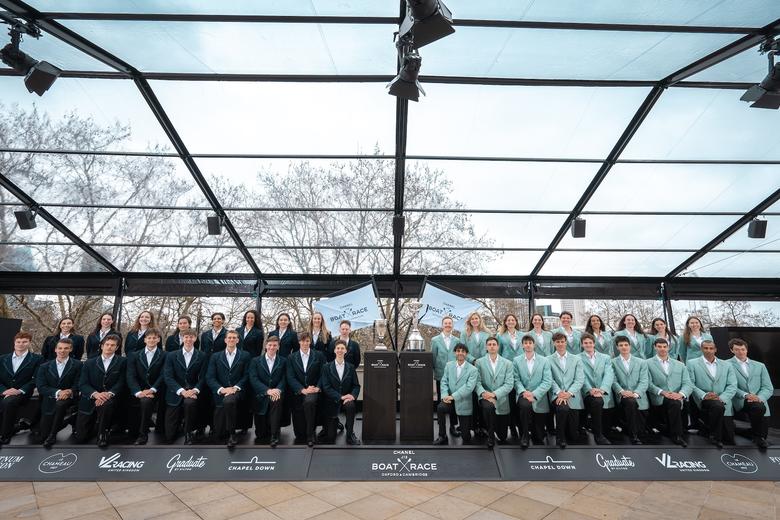
BOAT RACE CREWS ANNOUNCED
BOAT RACE CREWS ANNOUNCED
MARK WILKINSON
MARK WILKINSON

OFF THE SHELF: MARCH 2026
OFF THE SHELF: MARCH 2026
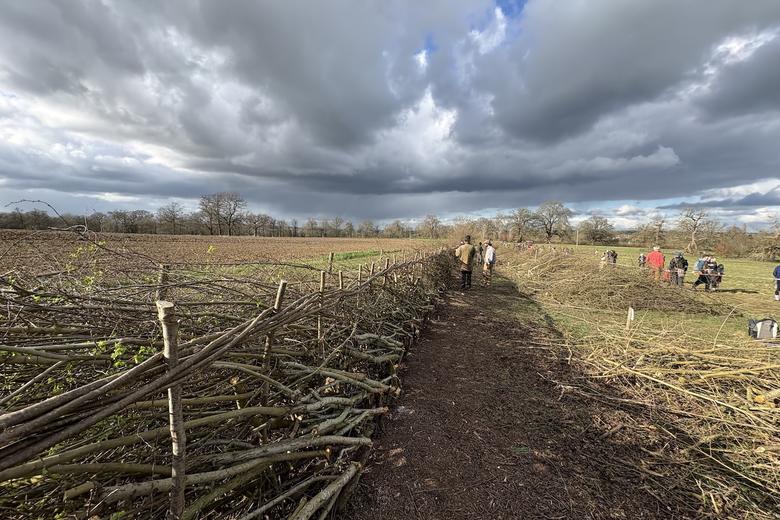
HEDGELAYING AT HARCOURT ARBORETUM
HEDGELAYING AT HARCOURT ARBORETUM

THROWING DOWN THE CLIMATE GAUNTLET
THROWING DOWN THE CLIMATE GAUNTLET
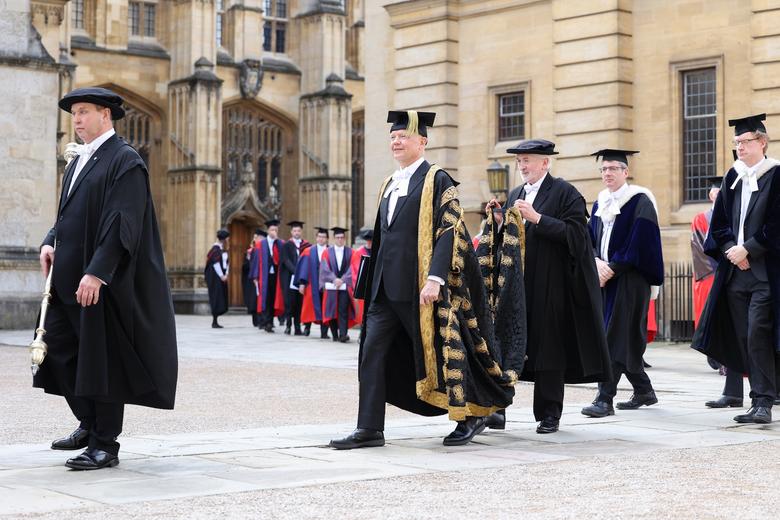
CHANCELLOR CONFERS SPECIAL HONORARY DEGREES
CHANCELLOR CONFERS SPECIAL HONORARY DEGREES
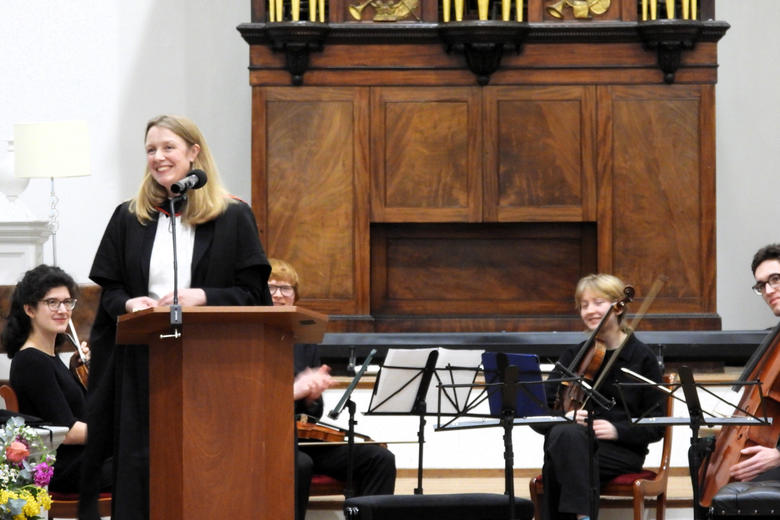
EVERYDAY BEETHOVEN
EVERYDAY BEETHOVEN
OXFORD ALUMNI RECOGNISED IN NEW YEAR HONOURS
OXFORD ALUMNI RECOGNISED IN NEW YEAR HONOURS
‘ARTISTS ARE THE GREAT CONVENORS’